My high school history teacher, Mr. Allen, said "history always repeats itself," and investor behavior may be one of the best examples.
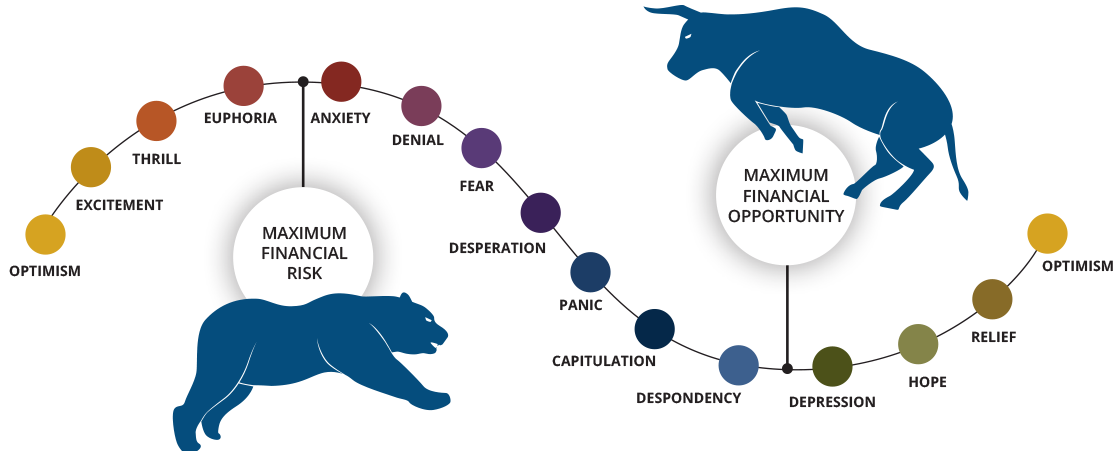
Clients who have read our articles over the years are probably familiar with the Market Cycle of Emotions diagram, which is one of our favorites and a key tenant of our
Investment Philosophy here at WT Wealth Management.

When I am asked "what is the single biggest mistake investors make", I always answer "doing the wrong thing at the wrong time". I say this not to criticize, but instead to highlight how biases of human nature can lead to poor investment decisions.
We know from the above diagram that investors tend to reach capitulation as the market approaches the bottom of the cycle and sell at the point of maximum financial opportunity. Ultimately, this panic-at-the-bottom reaction results in "realizing" losses and, more importantly, missing a potential recovery. Clearly, an important aspect of successful investing is overcoming these biases. This is where seeking the guidance of a trusted Financial Advisor can be invaluable.
Education may be the most important thing that we do. It empowers our clients to look past disheartening declines and instead focus on the recovery. The
Simple Math behind compound returns works in favor of investors who can avoid making poor investment timing decisions. It is a mathematical fact that to recoup a loss it takes a return greater than the initial loss. The table below shows this phenomenon at various loss levels.
| Starting Balance |
Percentage Loss |
Ending Balance
after Loss |
Gain Needed to
Recover Loss |
Ending Balance
after Gain |
| $1,000 |
5% |
$950 |
5.26% |
$1,000 |
| $1,000 |
10% |
$900 |
11.11% |
$1,000 |
| $1,000 |
15% |
$850 |
17.65% |
$1,000 |
| $1,000 |
20% |
$800 |
25.00% |
$1,000 |
| $1,000 |
25% |
$750 |
33.33% |
$1,000 |
| $1,000 |
30% |
$700 |
42.86% |
$1,000 |
| $1,000 |
35% |
$650 |
53.85% |
$1,000 |
| $1,000 |
40% |
$600 |
66.67% |
$1,000 |
| $1,000 |
45% |
$550 |
81.82% |
$1,000 |
| $1,000 |
50% |
$500 |
100.00% |
$1,000 |
| $1,000 |
55% |
$450 |
122.22% |
$1,000 |
| $1,000 |
60% |
$400 |
150.00% |
$1,000 |
| $1,000 |
65% |
$350 |
185.71% |
$1,000 |
| $1,000 |
70% |
$300 |
233.33% |
$1,000 |
| $1,000 |
75% |
$250 |
300.00% |
$1,000 |
| $1,000 |
80% |
$200 |
400.00% |
$1,000 |
| $1,000 |
85% |
$150 |
566.67% |
$1,000 |
| $1,000 |
90% |
$100 |
900.00% |
$1,000 |
| $1,000 |
95% |
$50 |
1900.00% |
$1,000 |
In a recent example, from December 26th, 2021 to October 9th, 2022, a span of 287 days, the S&P 500 declined 22.0% (including dividends). From October 9th, 2022, to July 31st, 2023, a span of 295 days, the S&P 500 reversed course and increased 27.8%, just shy of the 28.2% breakeven return. Clearly, if you stuck with the plan and resisted the impulse to sell when the market was down, your portfolio would be better off today.
Since the end of the Global Financial Crisis (GFC) in 2009, equity investors enjoyed the tailwind of historically low interest rates and monetary policy stimulus from the Federal Reserve which resulted in the longest bull run in the stock market in history. The post-GFC returns from 2009 to 2022 were simply stunning.
| Year |
Dow Jones |
S&P500 |
NASDAQ |
| 2009 |
18.82% |
23.45% |
43.89% |
| 2010 |
11.02% |
12.78% |
16.91% |
| 2011 |
5.53% |
0.00% |
-1.80% |
| 2012 |
7.26% |
13.41% |
15.91% |
| 2013 |
26.50% |
29.60% |
38.32% |
| 2014 |
7.52% |
11.39% |
13.40% |
| 2015 |
-2.23% |
-0.73% |
5.73% |
| 2016 |
13.42% |
9.54% |
7.50% |
| 2017 |
25.08% |
19.42% |
28.24% |
| 2018 |
-5.63% |
-6.24% |
-3.88% |
| 2019 |
22.34% |
28.88% |
35.23% |
| 2020 |
7.25% |
16.26% |
43.64% |
| 2021 |
18.73% |
26.89% |
21.39% |
| 2022 |
-8.78% |
-19.44% |
-33.10% |
https://www.1stock1.com/1stock1_142.htm
If you invested $100,000 in the S&P 500 at the beginning of 2009, you would have about $562,850 at the end of 2022, assuming you reinvested all dividends. This is a return on investment of 462.8%, or 13.1% per year. Emboldening investors further was the lack of a sobering sell-off over those 14 years. The only memorable pain surfaced in March of 2020, but the market had made new highs three months later and the 33.6% crash was quickly forgotten.

As our clients, we work for you. Our job is to help guide you through the complexities of investing so you can increase your chances of achieving your financial goals. This is why plans, and sticking to them, are so important. Fear breeds bad decisions almost invariably. We write Special Market Updates and research-driven White Papers, like this one, to keep our clients educated.
This is important because when it comes to your portfolio, you have the final say. That's why, at WT Wealth Management, we hope the next time the market makes an all-time high you call your Advisor and say, "let's take some profit and risk off the table". Or, when the market takes its next painful dip and presents a bargain, it would make my day if you couldn't wait to take some cash off the sidelines and invest it.
Then, the student has become the teacher.


